Mastering Candlestick Patterns: Your Visual Guide to Trading Success (Plus a FREE Bot!)
Welcome, traders and aspiring market wizards! Have you ever looked at a trading chart and wished you could understand the story it's telling? Those seemingly simple red and green bars, known as candlesticks, are actually powerful visual tools that can help you predict market movements. Today, we're diving deep into the most common and effective candlestick patterns, and as a bonus, I'll tell you how to get your hands on a free automated binary bot that uses these very patterns!
Candlestick patterns are a cornerstone of technical analysis, offering insights into market psychology and potential price reversals or continuations. By understanding how these 'candles' form, you can make more informed trading decisions, whether you're into forex, binary options, or any other financial market.
Let's break down some of the most crucial patterns you need to know:
The Essential Candlestick Patterns
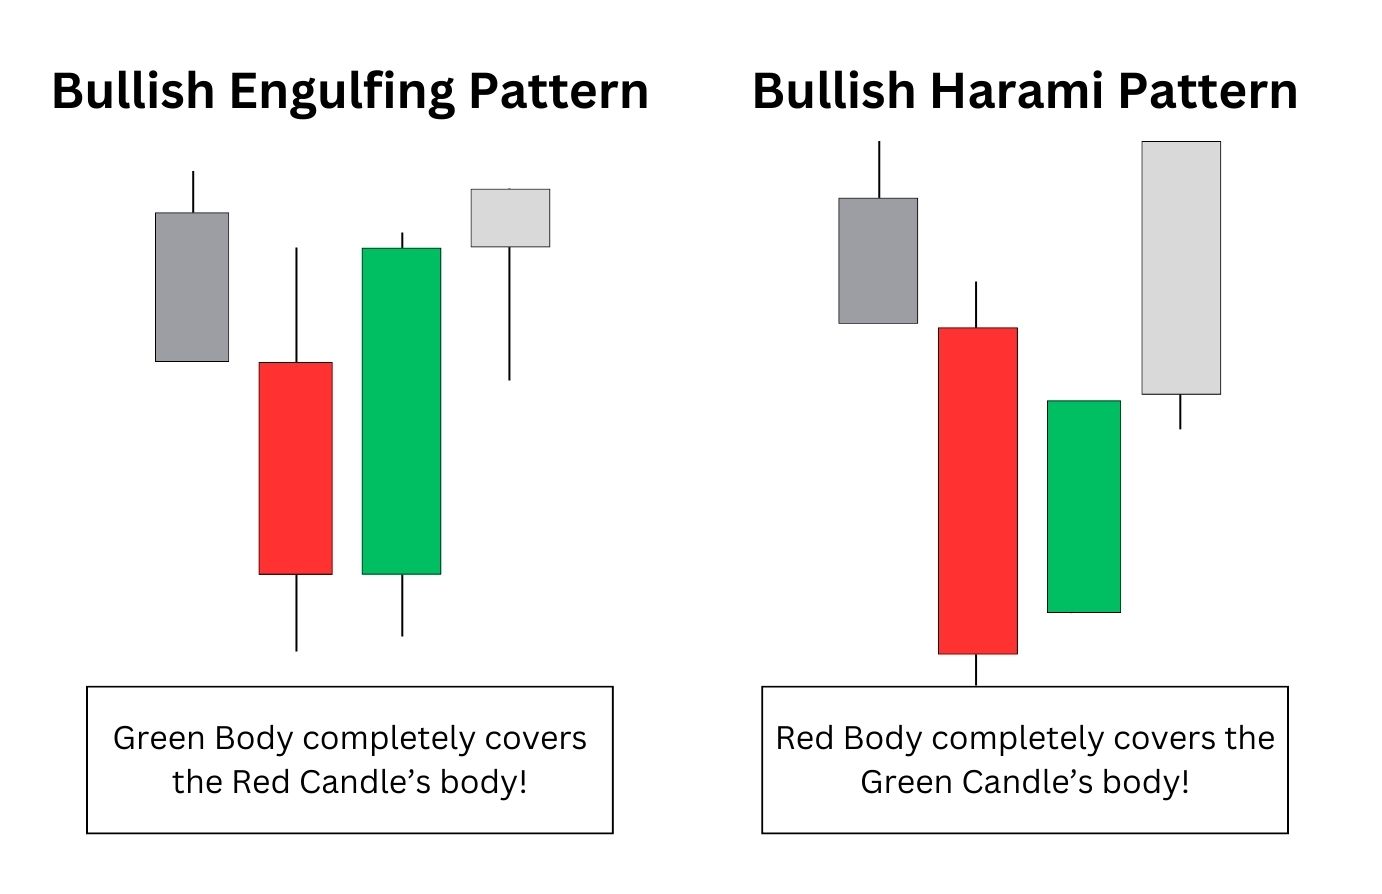
1. Bullish Engulfing Pattern
Imagine the market has been on a downtrend, and suddenly, a small red candle (indicating a price drop) is completely overshadowed by a much larger green candle that follows it. This is the Bullish Engulfing pattern. It's a strong signal that buyers have taken control, overwhelming the sellers and potentially reversing the downtrend. This often indicates a shift in momentum, suggesting prices are likely to rise. For binary options traders, this could be a prime opportunity for a 'CALL' option.
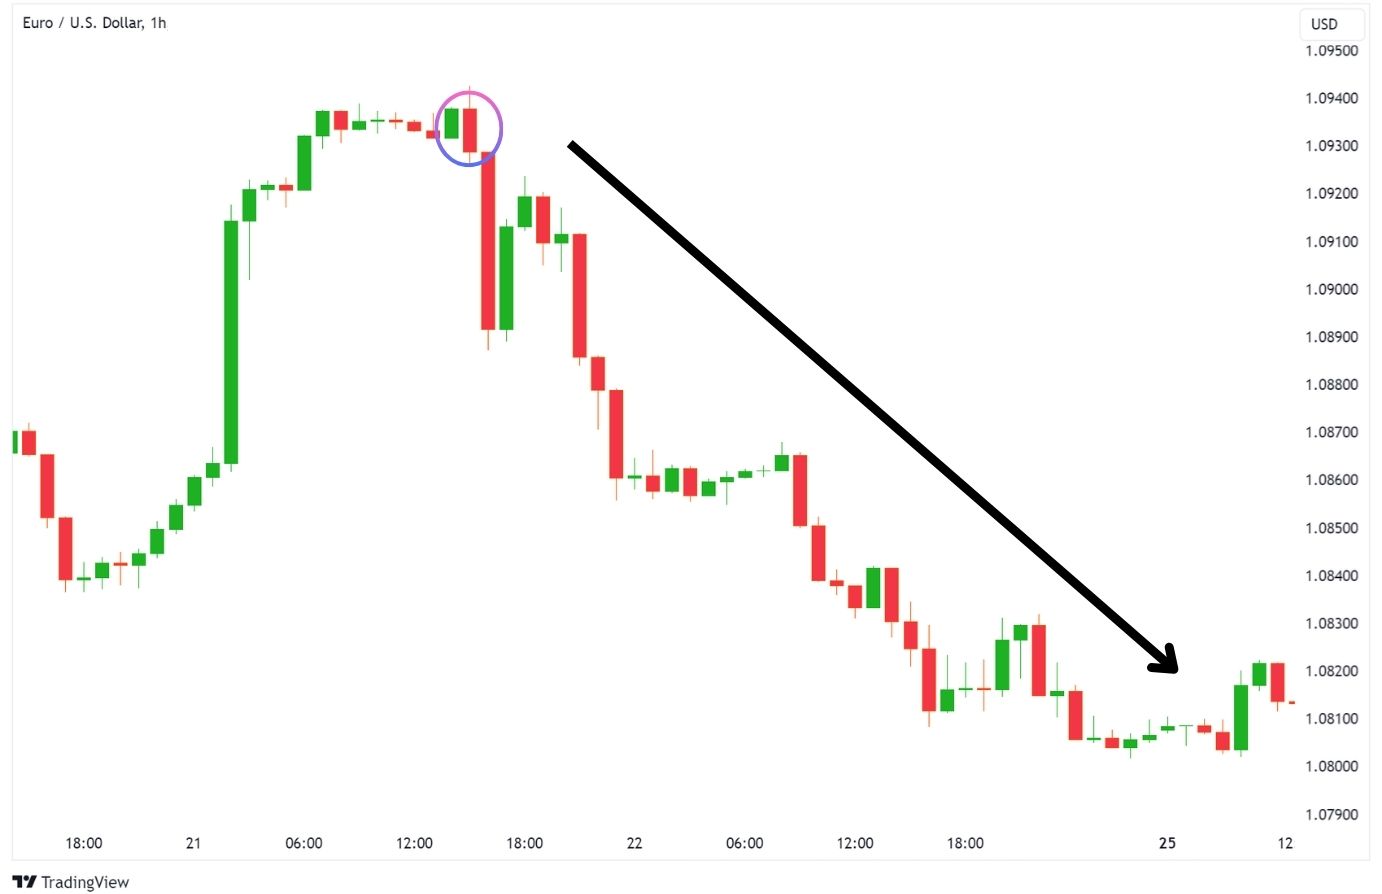
2. Bearish Engulfing Pattern
The Bearish Engulfing pattern is the exact opposite. Here, a small green candle (indicating a price increase) is completely engulfed by a larger red candle. This powerful formation suggests that sellers have stepped in with force, pushing prices down and potentially reversing an uptrend. It's a clear sign of bearish dominance and could signal a 'PUT' opportunity for binary options.
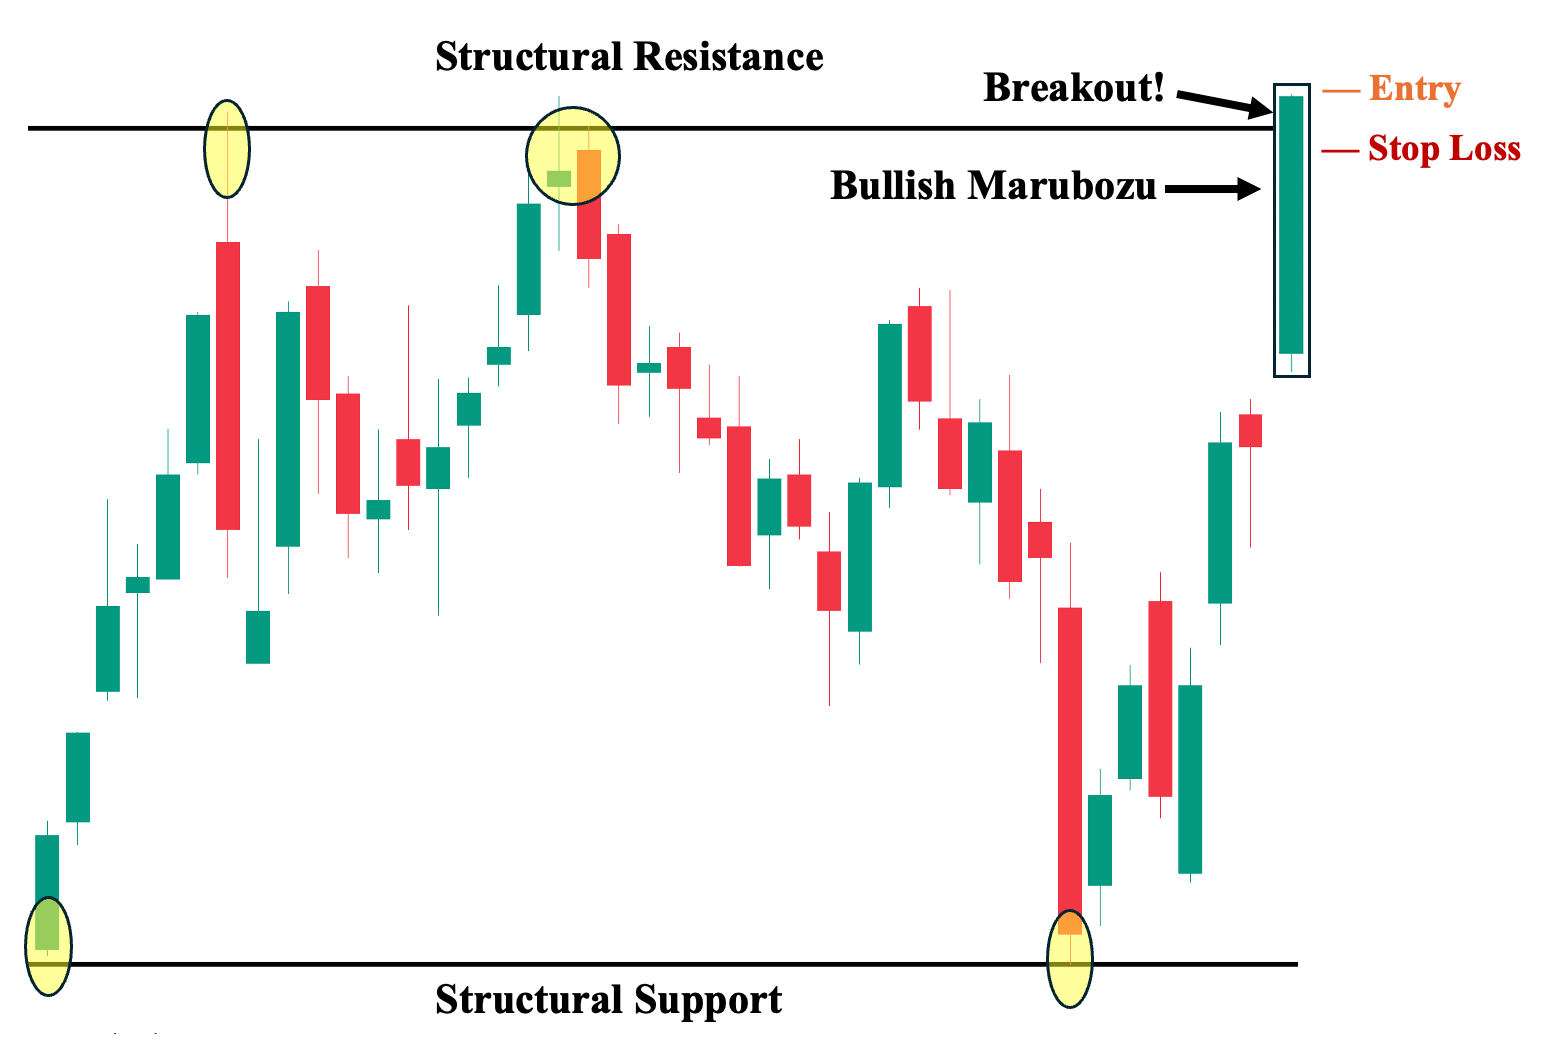
3. Bullish Marubozu
The Bullish Marubozu is a long, solid green candle with no wicks or shadows at either end. This means the opening price was the lowest, and the closing price was the highest. It signifies extreme buying pressure throughout the trading period, indicating strong bullish momentum and a high probability that prices will continue to rise. It's a clear, unambiguous display of buyer strength.
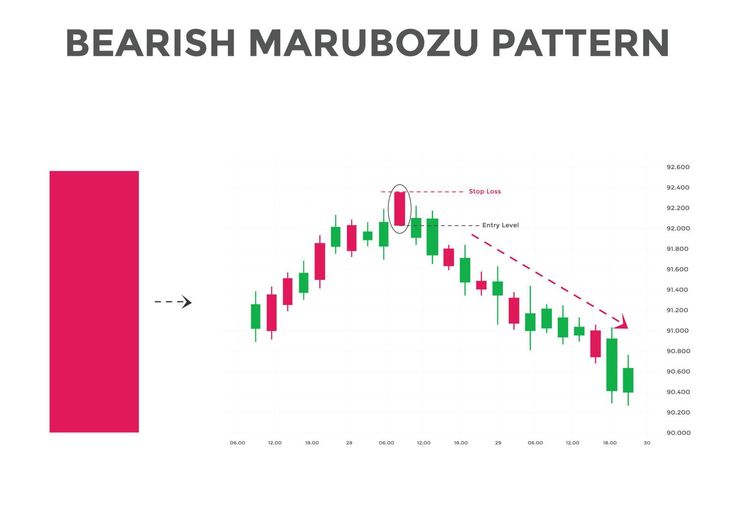
4. Bearish Marubozu
Conversely, the Bearish Marubozu is a long, solid red candle with no wicks. This indicates that the opening price was the highest, and the closing price was the lowest. It represents overwhelming selling pressure from start to finish, suggesting strong bearish momentum and a high likelihood of continued price decline. This pattern is a stark warning of seller dominance.
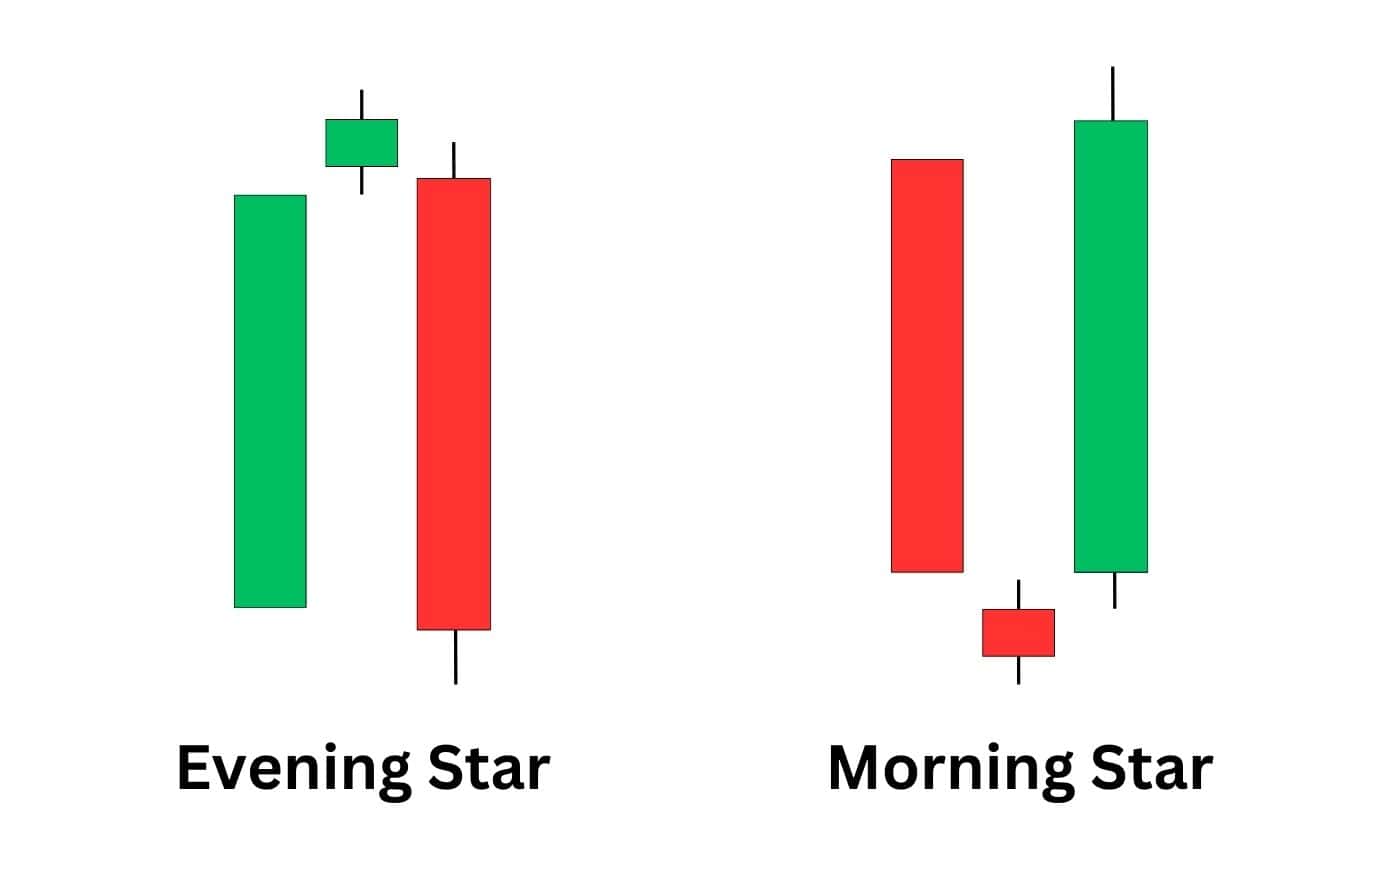
5. Morning Star
The Morning Star is a three-candle bullish reversal pattern, often appearing after a downtrend. It begins with a long red candle, followed by a small-bodied candle (which can be either red or green) that gaps down. This small candle signifies market indecision. The third candle is a long green candle that closes well into the body of the first red candle, indicating that buyers have regained control. It's a powerful signal of a potential upward reversal, much like the morning star signaling the end of night.

6. Evening Star
The Evening Star is the bearish counterpart to the Morning Star, signaling a potential downward reversal after an uptrend. It starts with a long green candle, followed by a small-bodied candle that gaps up, indicating indecision. The third candle is a long red candle that closes well into the body of the first green candle. This pattern shows that sellers have taken over, pushing prices down and suggesting a potential downtrend. It's a warning sign for bullish traders.
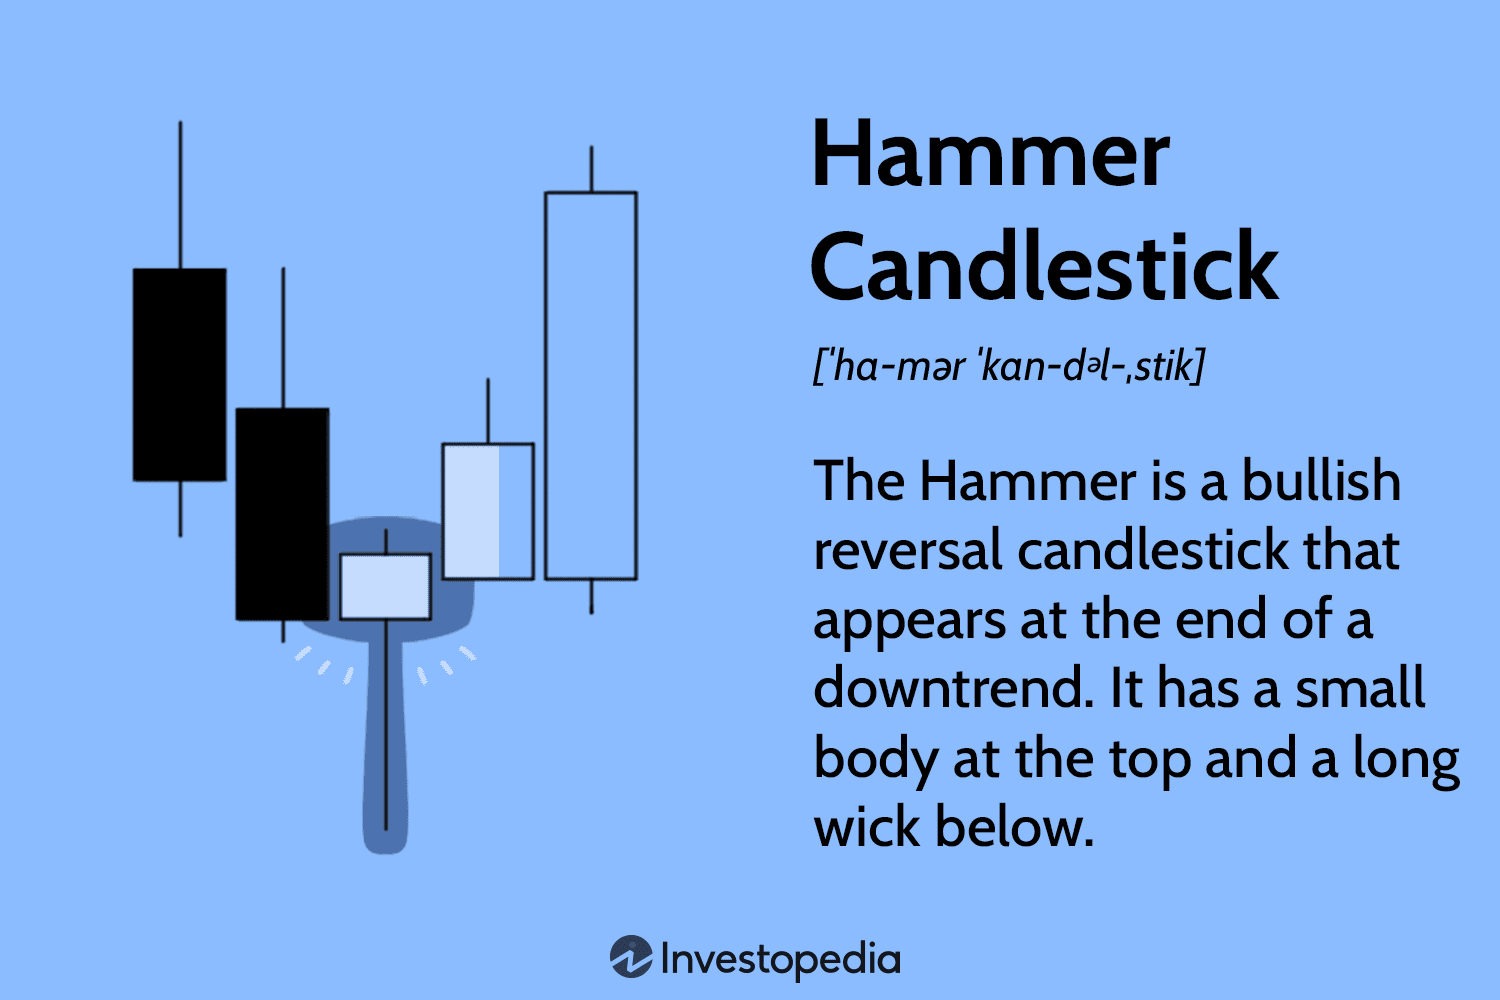
7. Hammer
The Hammer is a bullish reversal pattern that typically forms after a downtrend. It has a small body at the top of the trading range and a long lower wick (at least twice the length of the body). The long lower wick indicates that sellers initially pushed prices down, but buyers stepped in strongly to push them back up by the close. This shows strong buying interest at lower prices and suggests a potential reversal to the upside. A classic 'buy the dip' signal.
8. Inverted Hammer
The Inverted Hammer is another bullish reversal pattern, also appearing after a downtrend. It looks like an upside-down hammer, with a small body at the bottom of the trading range and a long upper wick. The long upper wick suggests that buyers tried to push prices higher, but sellers resisted, though buyers still managed to close the price near the open. This pattern indicates potential buying pressure and a possible reversal, as buyers are testing higher price levels.
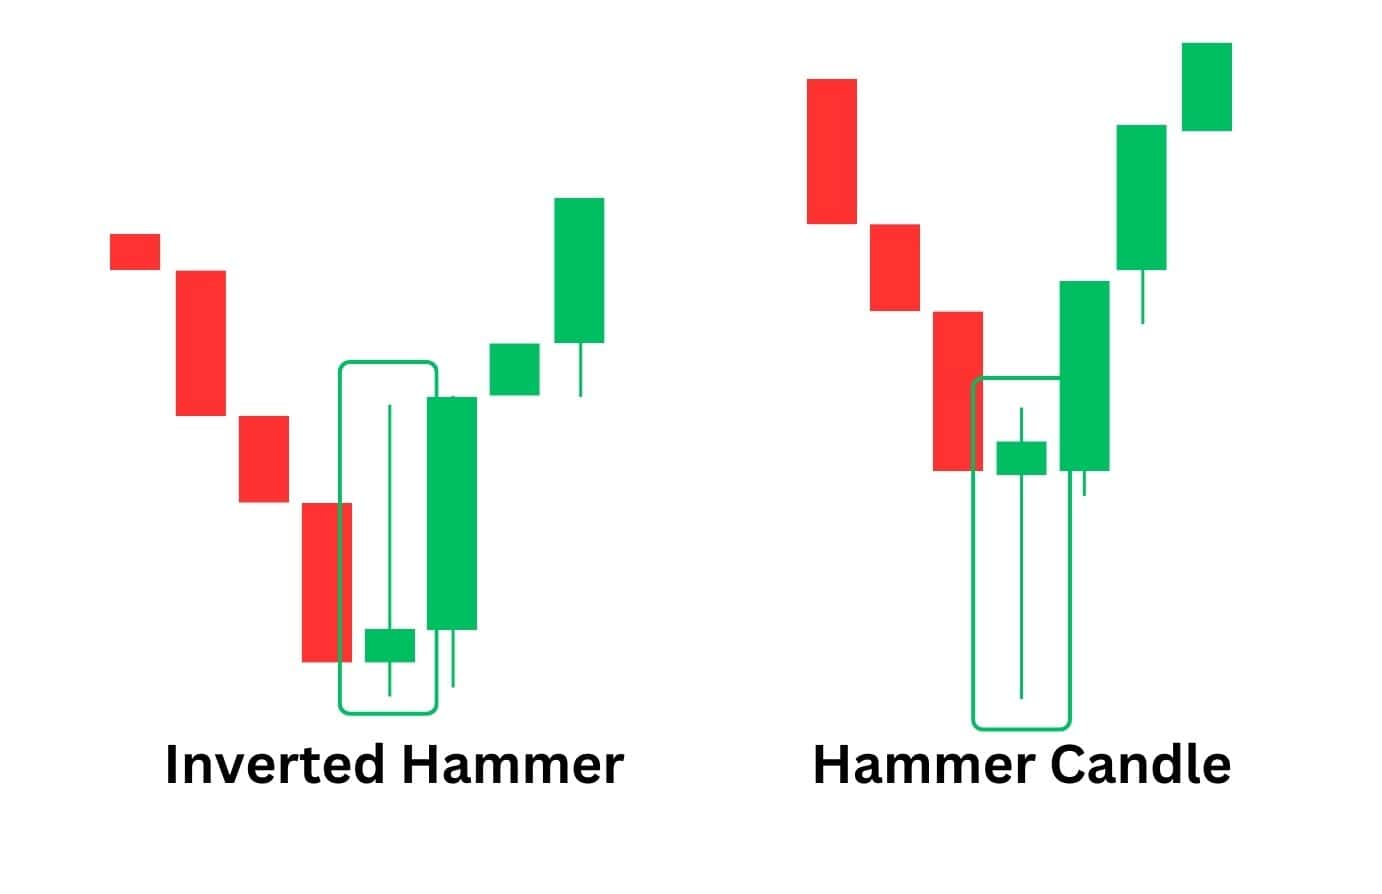
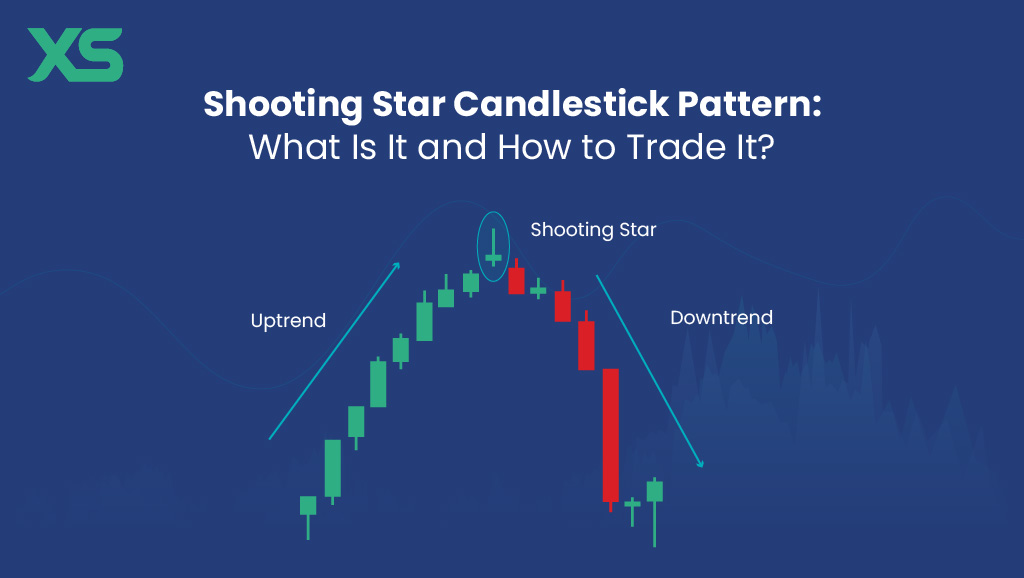
9. Shooting Star
The Shooting Star looks identical to the Inverted Hammer but appears after an uptrend, making it a bearish reversal pattern. It has a small body at the bottom and a long upper wick. The long upper wick signifies that buyers attempted to push prices higher, but sellers aggressively pushed them back down, indicating strong selling pressure. This suggests that the uptrend is losing momentum and a reversal to the downside may be imminent.
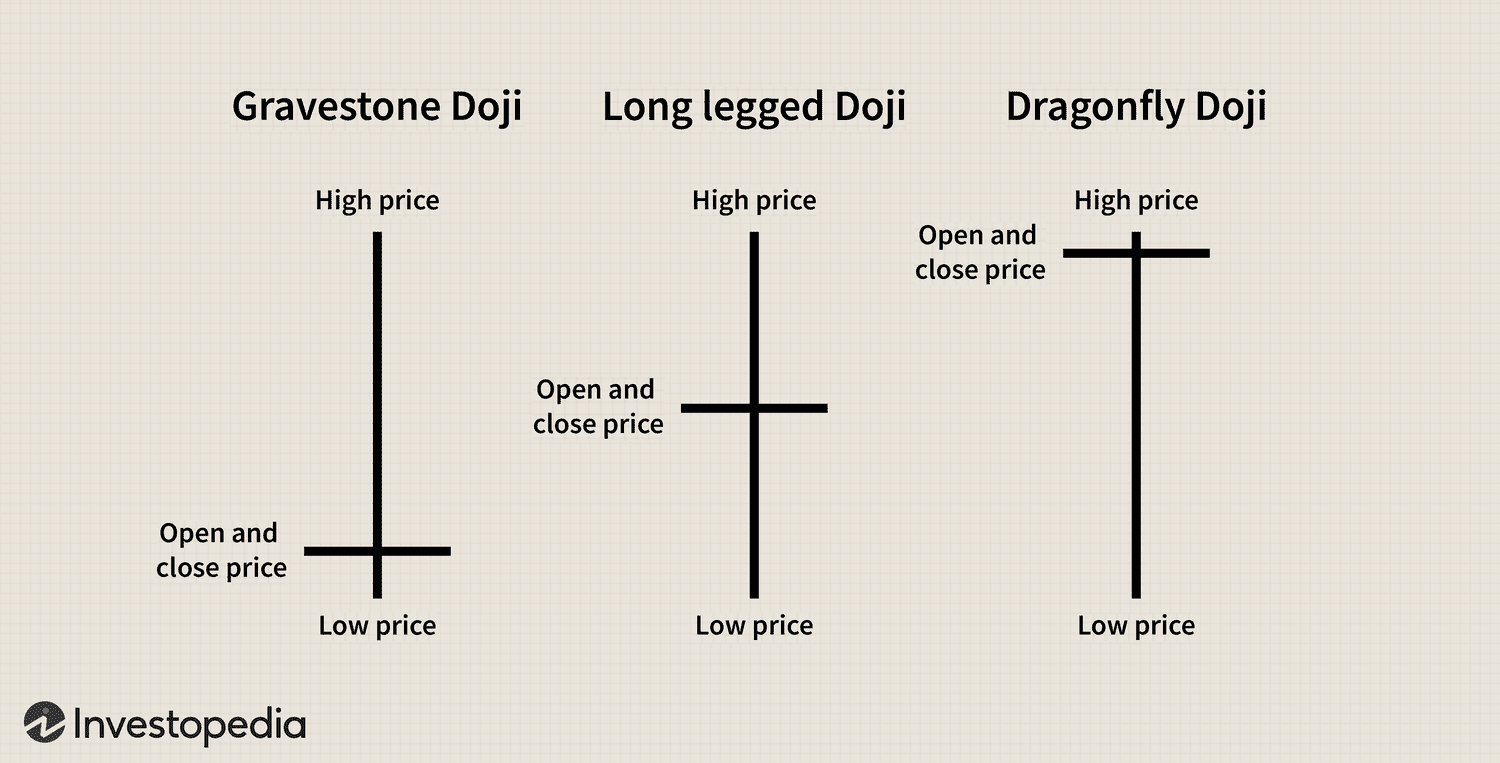
10. Doji
The Doji is a unique candlestick where the opening and closing prices are almost identical, resulting in a very small or non-existent body. It often looks like a cross, plus sign, or hyphen. A Doji signifies market indecision, where neither buyers nor sellers are in control. It can appear during trends or at potential reversal points. When you see a Doji, it's often a signal to wait for the next candle for confirmation of the market's next move, as it suggests a balance between supply and demand.
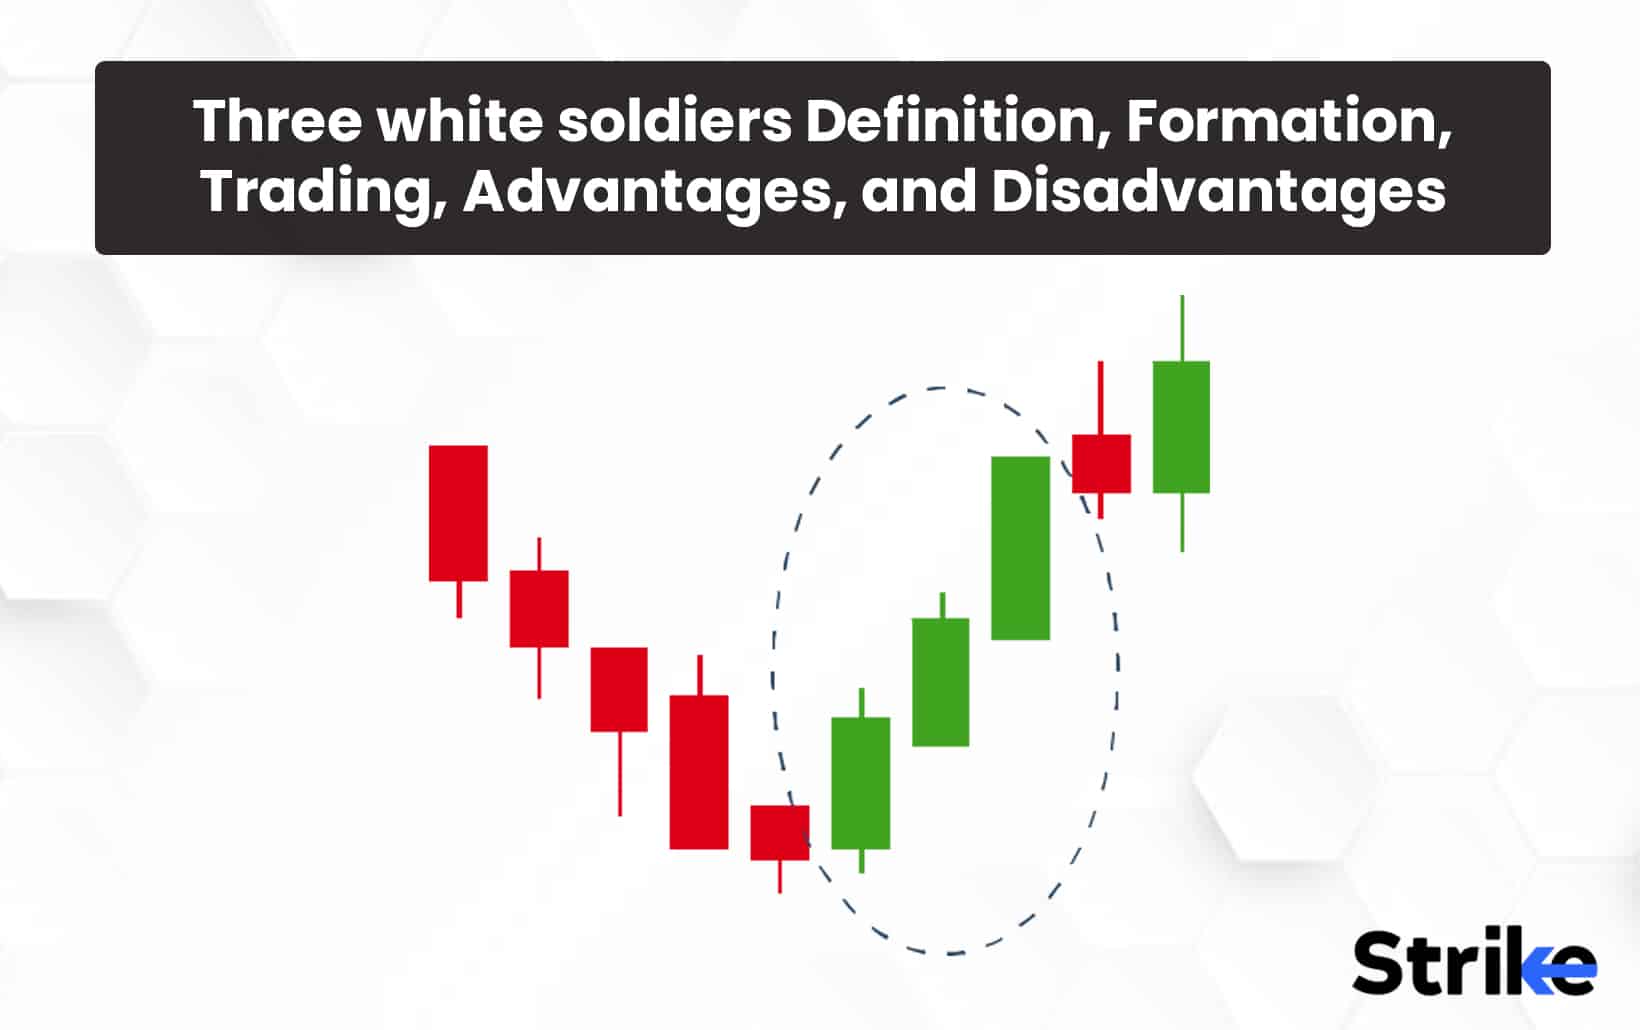
11. Three White Soldiers
The Three White Soldiers is a strong bullish reversal pattern that appears after a downtrend. It consists of three consecutive long green (or white) candles, each opening within the body of the previous candle and closing higher than the previous one. This pattern indicates consistent and strong buying pressure, suggesting a robust upward trend is beginning. It's a very optimistic signal for traders.
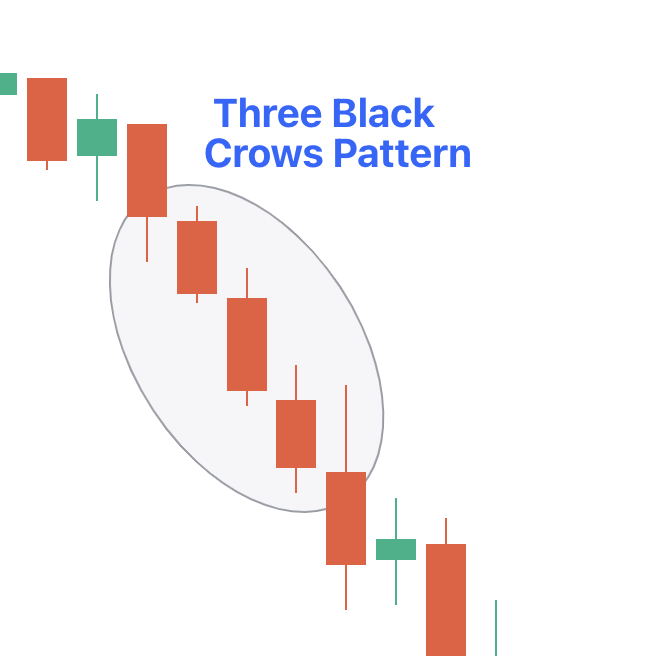
12. Three Black Crows
Finally, the Three Black Crows is the bearish counterpart to the Three White Soldiers, signaling a strong bearish reversal after an uptrend. It comprises three consecutive long red (or black) candles, each opening within the body of the previous candle and closing lower than the previous one. This pattern indicates consistent and strong selling pressure, suggesting a robust downward trend is beginning. It's a very pessimistic signal for traders.
Supercharge Your Trading with a FREE Automated Bot!
Understanding these candlestick patterns is incredibly powerful, but what if you could automate the process of identifying them and even executing trades based on their signals? That's where technology comes in!
I'm excited to announce that I've developed an automated binary bot that leverages these very candlestick patterns to help you make more informed and timely trades. And the best part? I'm giving it away to you, my amazing community, completely for free!
This bot is designed to work seamlessly on BinaryTools.io, providing you with an edge in the fast-paced world of binary options. It's built to analyze the market, spot these crucial patterns, and help you execute trades with precision.
USE THIS BOT IN BINARYTOOLS.IO
Support the Channel
To get your hands on this powerful tool and to help me continue creating valuable content like this, here's what you need to do:
1.Subscribe to this channel!
2.Like this video!
3.Share this video with anyone you think would benefit from learning about candlestick patterns and automated trading.
Your support fuels this channel and allows me to develop more free tools and educational content for you. Once you've done that, you'll find the link to download the bot, absolutely free, in the video description.
Remember, this bot is optimized for BinaryTools.io, so make sure you use it on that platform for the best results.
Conclusion
Candlestick patterns are an invaluable asset in any trader's toolkit. They provide a visual language for market sentiment, helping you anticipate price movements and make strategic decisions. Combine this knowledge with the power of automation through the free bot, and you're well on your way to enhancing your trading journey.
I hope this guide has shed some light on the fascinating world of candlesticks. If you have any questions or want to share your trading experiences, leave a comment below!
WATCH THE VIDEO: CLICK IMAGE BELOW


No comments:
Post a Comment